

 We have seen from the last two posts that natural phenomena tend to cluster about some center, but with variation on how far the individual occurrences of the phenomenon fall from that center. This is called a frequency distribution. The concepts of frequency distribution, centrality and variability are of prime importance in statistics, so they're highly important to grasp, in order to understand how the authors of The Bell Curve reach the conclusions they get.
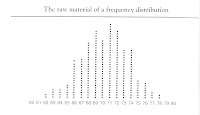
If you have a copy of the book, go to Appendix 1; Herrnstein and Murray say it better than I do. If not, above is an imagined overhead view of a high school senior class of guys (including girls would complicate matters in more ways than mathematically!) lined up in columns according to their height in inches:
We all have heard the word "average" many times: batting average, earned-run average, and so on. For everyday use the word is fine; for statistics it's not precise enough. The preferred term in statistics is "mean"; the mean is simply the sum of the occurrences of something divided by the number of occurrences. In the case of the high-school seniors, there are 250 guys, ranging in height from 5'2" to 6'6". The mean height (as a round number) is 70" or 5'10", calculated by multiplying each "x" (height) by its "y"+ (number of times x happens), and dividing that by the sum of the y's; that is, the sample size, n, 250. (to be precise, the mean height is about 70.26".)
This is a good example of how very many natural phenomena are distributed. There is a center, which can be calculated. There is distribution about the center, which is expressed in standard deviations. So what's a standard deviation? Basically, it's a measure of comparing apples to apples.
To quote the book: "When it comes to high school students, you have a good idea how big a six-inch difference is. But what does a six-inch difference mean when we are talking about the height of elephants? About the height of cats? It depends. And the things it depends on are the average height and how much height varies anong the things you are measuring. A standard deviation gives you a way of taking both that average and that variability into account, so that "6 inches" can be expressed in a way that means the same thing for high school students relative to other high school students, elephants relative to other elephants, and cats relative to other cats." (pp. 578-579; Emphasis theirs.)
Now a "true normal distribution," a perfect bell curve, is a mathematical abstraction, never observed exactly in nature. But if the sample of high school seniors were of 2500 boys, or 25,000 boys, or of 250,000 boys, the curve would tend to "smooth out" and approximate the ideal. In the mathematical ideal, the normal distribution extends to infinity in both directions, but for practical purposes, talking about populations of people, a normal distribution, or bell curve, is about six standard deviations (sd) wide, symmetrical, and centered on the mean.
The essential thing to remember is that in any normal distribution (or close approximation to it),
you will find that from the mean to +1sd or -1sd is 0.3413 or 34.13% of the population. Between 1sd and 2sd (either way) there
 will be 0.1359 or 13.59% of the population. Between 2sd and 3sd (again, either way) there will be 0.0213 or 2.13% of the population.
Add it all up -- 0.3413 + 0.3413 + 0.1359 + 0.1359 + 0.0213 + 0.0213 - and you get 0.997, which means that 99.7% of any distribution falls within the range -3sd to +3sd. The remaining three-tenths of one percent (three out of a thousand) fall outside this range. And as the authors explain, extremes tend to be rarer than the average. "It is worth pausing a moment over this link between a relatively simple measure of spread in a distribution and the way things in everyday life vary, for it is one of nature's more remarkable uniformities." (p.581)
Or as I like to say, as the understatement of the cosmos, "God is pretty smart."
In case this is discouraging anyone, it has taken me about four hours to write this; and it also happens that I started reading Peter Kreeft's A Shorter Summa last week, so I have to learn a whole new vocabulary too.
But we're getting close to the book. The only thing I see a need to talk about first are the concepts of regression and correlation. I bet you just can't wait!
No comments:
Post a Comment