Showing posts with label Math. Show all posts

Friday, April 26, 2013

Thursday April 25 -- I had to eat out anyway --

So I got a nice sticker.
But I changed it a bit, just for fun.I like obscure jokes.


Monday, December 26, 2011

Christmas Fun (well, fun for math types)

After exhaustive and exhausting investigation of the many variables involved (and hoo ha, are they variable!) it can be shown that on the twelfth day of Christmas, my true love will have given me:
12 drummers drumming,
22 pipers piping,
30 lords a-leaping,
36 ladies dancing,
40 maids a-milking,
42 swans a-swimming,
42 geese a-laying,
40 golden rings,
36 calling (or colly) birds,
30 French hens,
22 turtle doves, and
12 partridges in a pear tree (or pear trees; this last has not yet been ascertained).

For those who really really care, the graph resembles a parabola.

A merry, joyous, happy, holy and blessed Christmas to all!

Wednesday, December 14, 2011

Sacred Mathematics


As I was receiving last Sunday, the thought popped into my mind, "How can the Infinite fit into the infinitesimal?"


And it was followed by: "It just did."


Monday, December 5, 2011

After reading The Hitchhiker's Guide

My response at this moment to Life, the Universe, and Everything.
Forty-two!


There is an infinite number of numbers.
There is an infinite number of even numbers.
There is an infinite number of odd numbers.
The infinite number of all numbers is equal to the infinite number of even numbers and to the infinite number of odd numbers.
Do not think about this too much.


The universe is mind-bogglingly large.
The amount of information coded into the single 46-chromosome cell we all once were
is also mind-boggingly large.


Wednesday, November 16, 2011

Math, Carpentry, and Culture: a Facebook Rant

It's a mathematical axiom that through a point an infinite number of lines can be drawn. It's also an axiom that two points determine a line. But statistically speaking, the closer together those two points are, the less reliable are any predictions made from them.


In the real world, it's easy to lay a 10-foot 2x4 across two sawhorses six feet apart. Now try balancing the 2x4 across one sawhorse. Then try balancing it on a 1/2" rebar stuck into the ground. The smaller the base, the harder the balancing act.


The real-life analogy to this is that (all other things equal) we old folks have a longer, and therefore better, view of life and especially American culture than you young folks do. Culture is like the air you breathe: you don't notice it unless it changes or you have something to compare it to.


I grew up in the late 40s and through the 50s, and I can say that American culture has largely degenerated since then. I can smell the stink of it, but you young folks can't, because you grew up in it and don't know any better. You think it's fine and normal, I know it's rotten and abnormal.

Saturday, March 12, 2011

Sex Education and Physics

And I bet you're saying "Whaaat?!"

When I was in Physics 1 as a freshman engineering student at the University of Minnesota, one of the topics of study was falling-body problems. (No pun intended.) An object dropped from a height will cover distance downward according to the formula

s = (1/2 * g * t^2) where g is the acceleration due to gravity (and * means times, and t^2 means t-squared)

and the velocity of the object will be

v = g*t

To make things more interesting (read: complicated), the downward acceleration is independent of any forward motion the object might have, such as if the object were dropped from a moving airplane. Thus both downward and forward motions need to be analyzed. The math will show that a falling body in motion when dropped will follow a curve called a parabola, and its point of impact can be easily calculated.

But it's not as easy as that. There is air resistance, which increases proportionally to the mass and shape of the falling body, and (to make things even more interesting) changes the path of the falling body from a parabola to a cycloid.

So I asked the professor, "When do we get to figure air resistance?" and he replied, "Come back when you've had about five quarters of calculus."

Translated, this means: "You don't have the need or ability to understand that yet."

So with sex education. Little kids don't need to know about the "mechanics" of sex, because they don't have the need or ability to understand it (and though I'm not a parent, I would bet all my blog dollars they don't care either.)

I would venture to say that almost all little kids, when asking why Mommy's belly is getting big, being told that their little brother or sister is growing in there, will ask "Well, how'd he or she get there?" Parents correct me on this one, but I bet it will be quite enough to tell a small child, "God put him / her there."

Parents can tell their kids the equivalent of what the physics prof told me.

And I cannot state strongly enough that it's nobody's business but the parents' to give the child any more information, because the parents know their child better than any teacher possibly could, and they know when the child is able to absorb and assimilate the information.

(This applies only to ordinary kids in ordinary families, of course. The "special cases" are something else entirely.)

Tuesday, June 22, 2010

The Bell Curve 6 - More on cognitive stratification

The authors talked (in my last post) about cognitive stratification. They provided a couple of graphs to show the differences between, say, my parents' coming-of-age era, and that of their grandchildren. Here is one from 1930. Note that the mean IQ of the non-college persons is about 0.1 standard deviation (SD) less than the overall mean; the mean IQ of college graduates is about 0.7 SD above the overall mean; and the mean IQ of the grads from the prestigious colleges is about 1.3 SD above the overall mean.

Since the areas under the three curves are proportional to the relative size of the populations, it means if the three populations are combined, and taking their sizes into account, the combined mean will be the same as the mean of the whole population. It's the same as if you had a teeter-totter with a very large kid sitting one foot to the left of the pivot point, a small kid sitting about seven feet to the right, and a baby sitting about thirteen feet to the right.

Now here is a graph from 1990. Note that the mean IQs of the three populations have shifted: the non-college mean has dropped to about -0.25 SD below the overall mean IQ; the college grad mean has gone up to about +0.85 SD above the overall mean IQ, and the mean IQ of the grads of the prestigious colleges has taken a big jump to about +2.8 SD above the overall mean IQ. Quite a change in sixty years. As the authors predicted when they wrote the book in the mid-90s, this shift has profound social consequences.
At least one other author I read recently has confirmed, in a way, that what Herrnstein and Murray predicted has happened.

Saturday, June 12, 2010

The Bell Curve 5 - What they're talking about

(It has been quite a while, so you might want to go back and read my first four essays - Jan.9, Feb. 1, Feb. 2, and Feb. 6)

To quote the authors' preface: "This book is about differences in intellectual capacity among people and groups and what those differences mean for America's future."

In Part I, "The Emergence of a Cognitive Elite," the authors argue that in past ages and cultures, most notably western Europe, social class was determined largely by lineage and money rather than by intelligence. Therefore one would probably find a pretty normal distribution of intelligence at all class levels: that is, one could find smart peasants and stupid aristocrats.

". . . a large majority of the smart people in Cheop's (sic) Egypt, dynastic China, Elizabethan England, and Teddy Roosevelt's America were engaged in ordinary pursuits, mingling, working, and living with everyone else. Many were housewives. Most of the rest were farmers, smiths, millers, bakers, carpenters, and shopkeepers. Social and economic stratification was extreme, but cognitive stratification was minor." (p. 27)

One of the major premises of the book is that what they call cognitive stratification is a product of a high-tech society. Before the 20th century, ". . . the number of very bright people was so much greater than the number of specialized jobs for which high intelligence was indispensable." (ibid.) But during that century, assert the authors, a class structure based on intelligence emerged.

Chapter 1, "Cognitive Class and Education, 1900-1990," gives some information that I find highly interesting. The authors point out that from 1900-1990 there was a fifteen-fold increase in the proportion of people getting college degrees, and that students wishing to enter college were being more effectively selected for high IQ. They also mention that "Starting in the 1950s, a handful of institutions became magnets for the very brightest of each year's new class. In these schools, the cognitive level of the students rose far above the rest of the college population." (p. 29) They show with graphs (which one needs the smattering of statistics to interpret for oneself) that:

1, during the 20th century, the "prevalence" of the college degree went from about 2% to about 33% of the population;
2, starting about 1950, more of the top (high-school) students went to college;
3, between the 1920s and the 1960s, college attendance became more closely correlated to IQ, and
4, the cognitive sorting continued throughout one's college career.

"By the early 1960s," say the authors, "the entire top echelon of American universities had been transformed. The screens filtering their students from the masses had not been lowered but transformed. Instead of the old screen -- woven of class, religion, region, and old school ties -- the new screen was cognitive ability, and its mesh was already exceeding fine." (p. 42)

(I recall mentioning elsewhere that both my parents graduated from high school in 1931, and though they were both very bright people, for them college was out of the question. They went immediately to work, and mentioned many times they were lucky to find it. They pushed education at us six kids, with the result that all six went to college, we have five BA's and an AA, and four Master's degrees; more than that, two of my nieces have doctorates. I find it interesting that I would consider the girls part of the "cognitive elite"; my siblings and I, for the most part, definitely are not.)

Saturday, February 6, 2010

The Bell Curve 4 - Correlation and Regression

These terms may look formidable, but they're actually simple: common sense set to mathematics, if you will. In the diagram in part 3, we see that high school seniors' heights are distributed in a pattern - not a perfect one, but a pattern all the same.

Now, says the book, have the guys line up on the gym floor in columns by height, and in rows by weight, and if you were up on the rafters, you would see a pattern like this one. You'll see at once that there's a relationship between height and weight: the shorter guys tend to be lighter than the taller guys. In statistics, this is called correlation; it's a very important concept, and highly important for the purposes of the book, because the authors do a great deal of correlating various data with general intelligence.

(We could add a third measurement -- waist size -- to the two we have, and have a three dimensional graph; where height is the first "input variable" x, weight is the second "input variable" y, and waist size is the "output variable" z. And, believe it or not, one can make a pretty good estimate of z, given x and y, IF one has a large enough sample. When doing things like this, the sample size is very very important.)

But to go back to this graph -- if one calculates the means and standard deviations of both height and weight, and redraws the graph in terms of means and standard deviations (rather than the raw data), one gets a new picture of the data, and one can then draw what's called the regression line or "best fit line," which is a picture of the mathematical relationship between height and weight -- both of which, be it noted, are expressed in their own terms (remember the elephants and cats).
This means that if you look at the distribution of the guys' weights for the mean height (again, assuming a large sample), you can make some solid statements about how likely it will be -- for instance -- that a guy of mean height will fall two standard deviations below the mean weight (for this sample, nobody).
From here I let the authors speak. This is from pp. 586-587 of the book, Appendix I, "Statistics for People Who Are Sure They Can't Learn Statistics." I'm quoting them because they say things better than I can.
"1. Notice the many exceptions. There is a statistically substantial relationship between height and weight, but, visually, the exceptions seem to dominate. So too with virtually all statistical relationships in the social sciences, most of which are much weaker than this one.

"2. Linear relationships don't always seem to fit very well. The best-fit line looks as though it is too shallow. [my note: a horizontal best fit line means, mathematically, no correlation between x and y.] Look at the tall boys, and see how consistently it [the line] underpredicts how much they weigh. Given the information in the diagram, this might be an optical illusion -- many of the dots in the dense part of the range are on top of each other, as it were, and thus it is impossible to grasp visually how the errors are adding up -- but it could also be that the relationship between height and weight is not linear.
"3. Small samples have individual anomalies. Before we jump to the conclusion that the straight line is not a good representation of the relationship, remember that this sample consists of only 250 boys. An anomaly of this particular small sample is that one of the boys in the sample of 250 weight 250 pounds. Eighteen-year-old boys are very rarely that heavy, judging from the entire NLSY [explained later] sample, fewer than one per 1,000. And yet one of those rarities happened to be picked up in a sample of 250. That's the way samples work.
[My note: and one of the reasons people go to garage and estate sales and show up on "Antiques Roadshow."]
"4. But small samples are also surprisingly accurate, despite their individual anomalies. The relationship between height and weight shown by the sample of 250 18-year-old males is identical to the third decimal place with the relationship among all 6,068 males in the NLSY sample. This is closer than we have any right to expect, but other random samples of only 250 generally produce correlations that are within a few hundredths of the one produced by the larger sample. (There are mathematics for figuring out what "generally" and "within a few hundredths" mean, but we needn't worry about them here.)"
So anyway -- what The Bell Curve is all about -- "Intelligence and Class Structure in American Life" -- is based on lots of mathematical analysis of quite a few numerically measurable factors about people. I hope I have shown how some of the analysis works. I think one can appreciate the book much better if one has an understanding of the tools Herrnstein and Murray used, to get the results and come to the conclusions they did.
All that said, I want to go on record that the numerically measurable factors about any human being are not, repeat not the most important things. Thinking they are, is the fallacy that agnostics and atheists fall into. We believers know better. Science is great in its place, but it can't explain everything.

Tuesday, February 2, 2010

The Bell Curve 3 - Centrality and variability

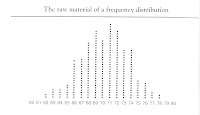
We have seen from the last two posts that natural phenomena tend to cluster about some center, but with variation on how far the individual occurrences of the phenomenon fall from that center. This is called a frequency distribution. The concepts of frequency distribution, centrality and variability are of prime importance in statistics, so they're highly important to grasp, in order to understand how the authors of The Bell Curve reach the conclusions they get.

If you have a copy of the book, go to Appendix 1; Herrnstein and Murray say it better than I do. If not, above is an imagined overhead view of a high school senior class of guys (including girls would complicate matters in more ways than mathematically!) lined up in columns according to their height in inches:

We all have heard the word "average" many times: batting average, earned-run average, and so on. For everyday use the word is fine; for statistics it's not precise enough. The preferred term in statistics is "mean"; the mean is simply the sum of the occurrences of something divided by the number of occurrences. In the case of the high-school seniors, there are 250 guys, ranging in height from 5'2" to 6'6". The mean height (as a round number) is 70" or 5'10", calculated by multiplying each "x" (height) by its "y"+ (number of times x happens), and dividing that by the sum of the y's; that is, the sample size, n, 250. (to be precise, the mean height is about 70.26".)

This is a good example of how very many natural phenomena are distributed. There is a center, which can be calculated. There is distribution about the center, which is expressed in standard deviations. So what's a standard deviation? Basically, it's a measure of comparing apples to apples.

To quote the book: "When it comes to high school students, you have a good idea how big a six-inch difference is. But what does a six-inch difference mean when we are talking about the height of elephants? About the height of cats? It depends. And the things it depends on are the average height and how much height varies anong the things you are measuring. A standard deviation gives you a way of taking both that average and that variability into account, so that "6 inches" can be expressed in a way that means the same thing for high school students relative to other high school students, elephants relative to other elephants, and cats relative to other cats." (pp. 578-579; Emphasis theirs.)

Now a "true normal distribution," a perfect bell curve, is a mathematical abstraction, never observed exactly in nature. But if the sample of high school seniors were of 2500 boys, or 25,000 boys, or of 250,000 boys, the curve would tend to "smooth out" and approximate the ideal. In the mathematical ideal, the normal distribution extends to infinity in both directions, but for practical purposes, talking about populations of people, a normal distribution, or bell curve, is about six standard deviations (sd) wide, symmetrical, and centered on the mean.

The essential thing to remember is that in any normal distribution (or close approximation to it),
you will find that from the mean to +1sd or -1sd is 0.3413 or 34.13% of the population. Between 1sd and 2sd (either way) there will be 0.1359 or 13.59% of the population. Between 2sd and 3sd (again, either way) there will be 0.0213 or 2.13% of the population.

Add it all up -- 0.3413 + 0.3413 + 0.1359 + 0.1359 + 0.0213 + 0.0213 - and you get 0.997, which means that 99.7% of any distribution falls within the range -3sd to +3sd. The remaining three-tenths of one percent (three out of a thousand) fall outside this range. And as the authors explain, extremes tend to be rarer than the average. "It is worth pausing a moment over this link between a relatively simple measure of spread in a distribution and the way things in everyday life vary, for it is one of nature's more remarkable uniformities." (p.581)

Or as I like to say, as the understatement of the cosmos, "God is pretty smart."

In case this is discouraging anyone, it has taken me about four hours to write this; and it also happens that I started reading Peter Kreeft's A Shorter Summa last week, so I have to learn a whole new vocabulary too.

But we're getting close to the book. The only thing I see a need to talk about first are the concepts of regression and correlation. I bet you just can't wait!

Monday, February 1, 2010

The Bell Curve 2 - what looks random maybe isn't

Here is a picture of my hand holding my little basket-like bathroom sink drain filter. I got curious a few years ago, and wondered if I held it like that, gave it a flip like a coin and let it bounce around inside the sink, whether it would seat itself perfectly in the drain hole. I knew it would get close to the drain, because of the shape of the sink -- but would it seat itself perfectly? I thought not: there were too many other ways it could end up.

So I started an experiment. I would flip the thing ten times, and see how many times out of ten flips it would seat itself perfectly. The results surprised me. In 187 trials of ten flips each, the numbers came out to be:

0 "perfect seatings" - 0 occurrences
1 ps - 2 occurrences
2 ps - 6
3 ps - 15
4 ps - 35
5 ps - 51
6 ps - 43
7 ps - 24
8 ps - 11
9 ps - 0
10 ps - 0

Note especially here that the data form a bell-shaped curve which is almost symmetrical. There is a pattern in what looks like randomness or chaos. I won't bore you with the math used to compute the "expected value" of X, the number of perfect seatings out of ten flips, but the answer, given the data, is about 5.18, which means that on average, in general, there is a slightly better than even chance that on any given flip, the strainer will seat itself perfectly.

Here's another example, a game called "coincidences." You shuffle a deck of cards, cut it, and deal thirteen cards off the top; as you lay down the first card, you say "ace"; as you lay down the second card, you say "deuce," as you lay down the third, you say "trey," and so on up to jack, queen, and king. The question is: what is the chance that you'll get at least one "coincidence" as you lay out the cards -- that, for example, as you say "six" you turn up a six? It would seem far-fetched -- until you do it. I played the game 150 times and got:

zero coincidences 54 times
one coincidence 56 times
two coincidences 29 times
three coincidences 9 times
four coincidences 2 times

which means the odds (chance, probability) of getting at least one coincidence are slightly under 2/3; for this group of trials, p(x) = 0.6204. Note "p(x)" means "probability of x happening," where p by definition is a decimal between 0 and 1, where 0 means impossibility and 1 means certainty.

(I mention in passing that this game can be used to win beers at your local watering hole, because the results are counter-intuitive. You never heard me say this.)

And of course a pattern strongly implies a pattern-Maker.

Friday, January 29, 2010

The Bell Curve 1 - to scare off the wimps


This is the equation that describes how something that can happen only one of two ways, p, and q, will happen if you make it happen n times. Say you have ten coins and you flip them all together 1024 times.

The equation says (very briefly) that in an ideal world you will get:

0 heads and 10 tails - 1 time

1 head and 9 tails - 10 times

2 heads and 8 tails - 45 times

3 heads and 7 tails - 120 times

4 heads and 6 tails - 210 times

5 heads and 5 tails - 252 times

6 heads and 4 tails - 210 times

7 heads and 3 tails - 120 times

8 heads and 2 tails - 45 times

9 heads and 1 tail - 10 times

10 heads and 0 tails - 1 time

Or to put it another way: the probability or "chance" of getting 0 heads and 10 tails is 1/1024 or 0.000976563 (plus or minus a smidge; my calculator can display only 10 digits).

Similarly, the probability of

1 head and 9 tails is 10/1024 or 0.0098 (rounded to four decimal places)

2 heads and 8 tails is 45/1024 or 0.0439

3 heads and 7 tails is 120/1024 or 0.1172

4 heads and 6 tails is 210/1024 or 0.2051

5 heads and 5 tails is 252/1024 or 0.2461

6 heads and 4 tails is 210/1024 or 0.2051

7 heads and 3 tails is 120/1024 or 0.1172

8 heads and 2 tails is 45/1024 or 0.0439

9 heads and 1 tail is 10/1024 or 0.0098

10 heads and 0 tails is 1/1024 or 0.0001

These are shown on the "bell-curve" graph.


Enough with the numbers already. There are two important things to especially notice here:


1, the distribution of probabilities is symmetrical.

2, this is for an ideal situation; in a real test the numbers will not come out exactly like this (but that's the way to bet - the tendency will be towards this distribution especially if you flip the ten coins a "very large" number of times. How big "very large" is, we don't have to think about, Deo gratias).

G.K. Chesterton said in Orthodoxy, Chapter 6, "The Paradoxes of Christianity":

"The real trouble with this world of ours is is not that it is an unreasonable world, nor even that it is a reasonable one. The commonest kind of trouble is that it is nearly reasonable, but not quite. Life is not an illogicality; yet it is a trap for logicians. It looks just a little more mathematical and regular than it is; its exactitude is obvious, but its inexactitude is hidden; its wildness lies in wait."

and

"It is this silent swerving from accuracy by an inch that is the uncanny element in everything. It seems a sort of secret treason in the universe."

And Damon Runyon (also well worth reading) said: "The race is not always to the swift, not the battle to the strong, but that's the way to bet."

Monday, September 21, 2009

Connecting Some Ideas

I was just reading Alan Keyes' essay on the 80/20 fallacy (for which see his blog http://loyaltoliberty.blogspot.com/) and a few things occurred to me.

One is that some prominent Churchman (may have been Benedict) recently wrote on the philosophical error of confusing quantity and quality. The effect of this in the practical and political spheres is that people are regarded as interchangeable units. The origin of the error is a denial of the sacred unique-ness of each human person, and further back than that, a denial of God the Creator.

G. K. Chesterton wrote his great work The Everlasting Man to demonstrate that Man differs from the brute animals not in degree but in kind. (And I don't care what "scientists" say about the similarity of human and chimp DNA.) Chesterton said: "So stands the Red Clay against the green field of nature, or the White Christ against the red clay of his race."

Now the 80/20 rule, which I learned in my statistics classes, is often called "Pareto's Law" or "The Pareto Principle," and it says basically that 80% of the effects come from 20% of the causes. It's really just an empirical rule of thumb, and the number doesn't have to be 80 -- just somewhere between 50 and 99 -- but it applies in a lot of real word cases in statistics.

My take on Pareto's Principle tonight is that 85% of the BS in this country today comes from 15% of the population. And I hope you know who I think they are: the Usual Suspects on the Left, led by our Great Leader.

And when I thought of Pareto's Principle, I thought of Parkinson's Law -- "Work expands so as to fill the time available for its completion." This book (published 1957) explains why our federal bureaucracy is growing like lawn fungus after a rainstorm.

And then I thought of the Peter Principle -- "In a hierarchy every employee tends to rise to his level of incompetence." And we have now seen the principle demonstrated in a manner which can hardly be excelled . . . or should that be worsened?

Friday, May 1, 2009

Science and Religion

I could get long-winded really easily on this topic, but I'll spare us all.

In short, there is no real conflict between real science and real religion. Science tells us how the heavens go, religion tells us how to go to heaven. (I didn't make that up; I'm stealing from, and paraphrasing, one of the prelates involved with the Galileo affair.)

While I was working as an engineering technician, I had the equivalent of four university-level courses in statistics. (I got good enough -- or arrogant enough -- that I argued with management about the best tools for predicting traffic growth.)

Take ten coins, and flip them all at once. Now the chance of any one coin coming down heads or tails is exactly 50-50 (assuming the coin doesn't land on its edge or hang in the air). So you would maybe expect to get five heads and five tails tossing ten coins. But in fact your chance of getting exactly that is a bit less than 1 in 4, that is, it's 252 out of 1024; because there are 1024 different ways ten coins can fall when you flip them all at once.

The reason for this is that a coin has two faces, you have ten of them, and the number of ways they can fall is 2^10, 2 to the 10th power, 2x2x2x2x2x2x2x2x2x2, 1024.

One more example. Say you get into a crap game. Each die has six faces, you have two of them, and the number of ways they can fall is 6^2, 6 squared, 6x6, 36. If you analyze the 36 combinations, you will find that you can throw a seven only 6 ways, so your chances of getting a win, "take all the money," on your first toss is only 6 out of 36, or 1 in 6. Some places, an 11 on the first throw is a winner, and the chance of a win on the first toss is then 8 out of 36 or a bit less than 1 in 4, but the principle is the same, and the point is your chances of getting exactly what you want are not in your favor. Moral: don't get into crap games.

The basic point is that the toss of one coin or ten, or the toss of one die or two, is a random event, but when you start collecting and recording a large number of them, you will see a pattern.

Behind what looks like chaos there is order.

And the order was put there by God. It didn't happen by itself, because nothing can come from nothing.